Using Microsoft Office for
Mac as a Relational Database
By Jim Gordon, co-author of Office 2011
for Mac All-in-One For Dummies.
Part 7 - Queries - A step by
step how-to example
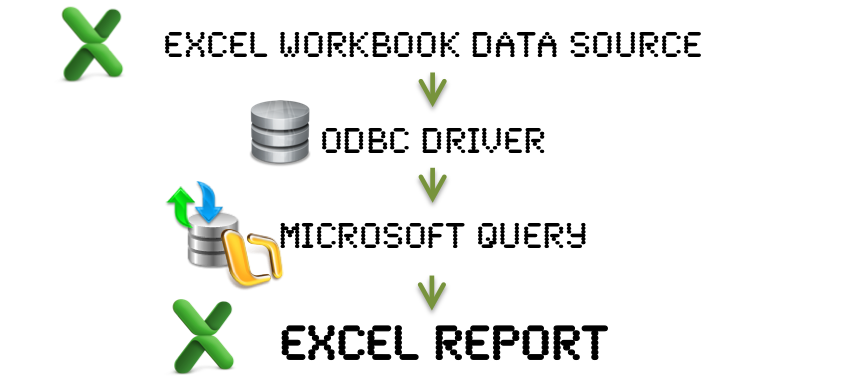
On this page, we will generate a
report based on a simple query. This
flowchart explains visually how the data will flow:
You're going to need some data. If
have not yet already done so, make a folder called DatabaseExample
in your Documents folder. Click here and save the linked
content ExampleData.xls file into the DatabaseExample
folder you made. Exampledata.xls is an Excel
workbook that has the data used for the examples in this
tutorial. For your own purposes in the future, when you make
additional databases, you should make a new DatabaseWhatever
folder for each new database.
Now that you have data to work with, you're ready to make a
report. It's not required, but I suggest saving reports
associated with a data source in the same folder as the data
source unless your data source is located on a network share.
The next step is to make a folder called Reports in
the DatabaseExample folder we made earlier.
In this example you will make a report on a worksheet in an
Excel workbook.
1. In Applications > Utilities open ODBC Manager application.
2. A data source can be made available to all users on a Mac
(SYSTEM DSN) or just the Mac OS current user (USER DSN). In
ODBC Manager, choose either USER DSN or SYSTEM DSN
tab depending upon which Mac OS users will have access to this
data source. When adding new data source names, do not use the
same data source name on USER and SYSTEM tabs. Do not use reserved words as
data source names.
3. Click the Add button
4. Choose the Actual Access driver if using an Excel
workbook as the data source (or other driver as appropriate),
and then click the Finish button to configure the
driver.
5. In the Introduction panel of the DSN Configuration
wizard click CONTINUE
6. In the Enter Data Source Name panel, type a name
and description for the new data source. For this tutorial the
name of ExampleData is used for both the name and the
description. Then, click the Choose button and
navigate in Finder to the saved ExampleData.xls file in the
DatabaseExample folder and choose ExampleData.xls. Then click
the CONTINUE button.
7. In the Database Information panel click the CONTINUE
button.
8. In the Conclusion panel click the DONE
button. If you were successful, you will see your new data
source in the ODBC Manager dialog.
9. Quit ODBC manager. Your data source is now ready to be used
and will remain available for repeated use until you delete
it.
10. Open a new, blank Excel
workbook.
11. Use File > Save As and save the workbook in the
Reports folder you made. A name suggestion is EmployeeReport.xlsx.
12. Excel 2016: On the Data menu choose Get
External Data > From Database
Excel 2011; On the
Data tab of the Ribbon choose New Database Query >
From Database
The Data Source Chooser dialog
opens:
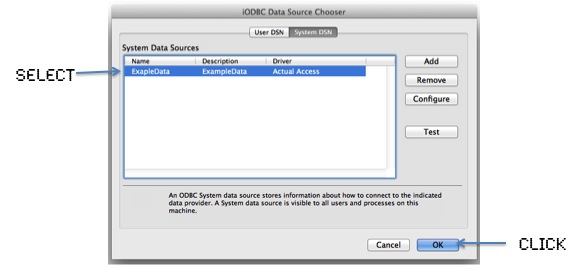
13. Select a data source on either the DSN or System
tab.
14. Click the OK button.
Microsoft Query will open.
STEPS 15 through 19 are different for Excel 2016 and Office
2011. Instructions for 2011 follow instructions for 2016,
below.
FOR EXCEL 2016 FOLLOW THESE INSTRUCTIONS
The Microsoft Query
application window is divided into 3 panels.
15. Click the
disclosure triangle in the left panel to display the
names of the database tables.
16. Click a table name
to generate a Select All (Select * From TableName) query
in the Query editing panel.
17. Click the Run
button to see the first few records of your query. The
full result set does not display when you click the Run
button.
18. Click the Return
Data button to bring the result set into Excel
and close Microsoft Query.
FOR
EXCEL 2011 FOLLOW THESE INSTRUCTIONS
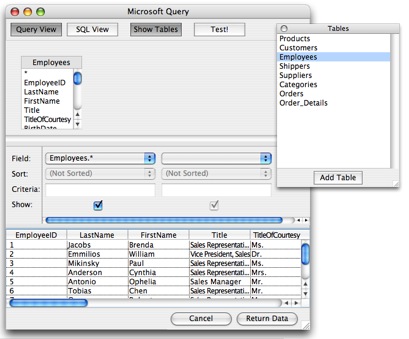
The Microsoft Query window
divided into 3 panels. There is a smaller window that lists
the tables in ExampleData.xls. We're going to select all the
records in the Employees table for our report.
15. In the Tables
window, Select EMPLOYEES. In MS Query 2016 a Select
* from Employees query will automatically display. In MS
2011, click the Add Table button or double-click on
EMPLOYEES. EMPLOYEES will appear in the tables panel in the
Microsoft Query window.
16. Click on the Field:
pop-up to select columns for your report. Choosing the
asterisk * selects the entire table. Columns can be dragged
within the interface to change the order of the fields.
17. Click Test! to
display the query result records in the bottom (result set)
panel.
18. [Optional] Click the SQL
View button to see the syntax of your SQL query. In this
example the query is SELECT Employees.* FROM Employees
19. Click the Return Data
button (lower right corner of Microsoft Query window) to
bring the result set into Excel.
INSTRUCTIONS CONTINUE FOR
EXCEL 2011 AND EXCEL 2016
Excel will offer a variety of options that let you control how
where Excel puts the data once the import has been completed.
For this example, choose to return the data to the active
worksheet in cell A1 by clicking the OK button as shown here:
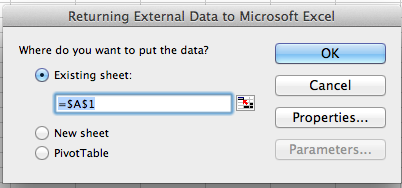
Note that you can return data
from Microsoft Query to an existing worksheet, a new
worksheet, or a PivotTable report.
The Properties button of the Returning External Data
dialog is discussed in Part
9.
You have now successfully created a report. Use Command-S or
click the Save button to save your finished report as an Excel
workbook.
Data from Microsoft query is in a special range called a query
table, which by default has Table formatting turned on so you
can format it using the Table tab of the Ribbon.
You have completed the basic steps for generating a report.
The basic procedure is summarized here:
- In an Excel workbook click the
Data tab of the Ribbon and choose a Database
- Add tables and criteria to
your query
- Return Data
When Microsoft Query is open you
may be able to see the your worksheet or other things in the
background. In Excel 2011, if you move the cursor from
Microsoft Query you will see a spinning rainbow. This is
normal. The rainbow is to advise you to not modify the Excel
workbook while you have Microsoft Query open.
You can make an unlimited number of reports based on the same
database. You only have to maintain one Data Source Name for a
given database.
Reports that depend upon data can be kept current by clicking
the Refresh button on the Data tab of the Ribbon.
Use ODBC Manager.app to
add, remove and configure data sources in all versions
of Mac OS.
Users
of Lion and Mountain Lion: When you display the Data
Source Chooser dialog (see step 12 above) don't click the
Add button to add a new data source. If you do,
you will crash Microsoft Query because the configuration
routine has not been updated and requires Rosetta, which is
not in Lion or Mountain Lion.